

What Happened in 2016?
go.ncsu.edu/readext?474995
en Español / em Português
El inglés es el idioma de control de esta página. En la medida en que haya algún conflicto entre la traducción al inglés y la traducción, el inglés prevalece.
Al hacer clic en el enlace de traducción se activa un servicio de traducción gratuito para convertir la página al español. Al igual que con cualquier traducción por Internet, la conversión no es sensible al contexto y puede que no traduzca el texto en su significado original. NC State Extension no garantiza la exactitud del texto traducido. Por favor, tenga en cuenta que algunas aplicaciones y/o servicios pueden no funcionar como se espera cuando se traducen.
Português
Inglês é o idioma de controle desta página. Na medida que haja algum conflito entre o texto original em Inglês e a tradução, o Inglês prevalece.
Ao clicar no link de tradução, um serviço gratuito de tradução será ativado para converter a página para o Português. Como em qualquer tradução pela internet, a conversão não é sensivel ao contexto e pode não ocorrer a tradução para o significado orginal. O serviço de Extensão da Carolina do Norte (NC State Extension) não garante a exatidão do texto traduzido. Por favor, observe que algumas funções ou serviços podem não funcionar como esperado após a tradução.
English
English is the controlling language of this page. To the extent there is any conflict between the English text and the translation, English controls.
Clicking on the translation link activates a free translation service to convert the page to Spanish. As with any Internet translation, the conversion is not context-sensitive and may not translate the text to its original meaning. NC State Extension does not guarantee the accuracy of the translated text. Please note that some applications and/or services may not function as expected when translated.
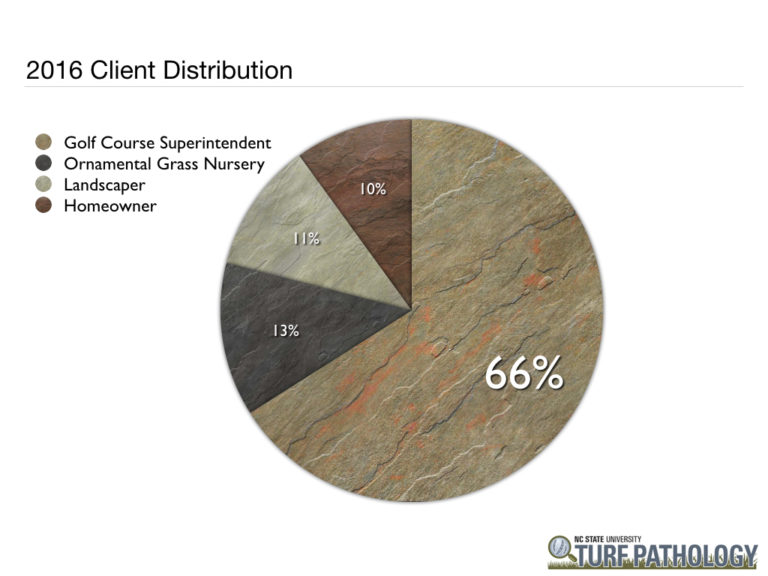
Collapse ▲Overall, turfgrass samples submitted to the NC State Turf Diagnostics Lab were down by 6% when compared to 2015. As expected, the majority (66%) of our samples came from golf course putting greens. Creeping bentgrass putting green samples were down 5% while bermudagrass putting green samples were up 12% when compared to 2015. Below you will find information regarding all golf course putting green samples submitted in 2016. Enjoy!
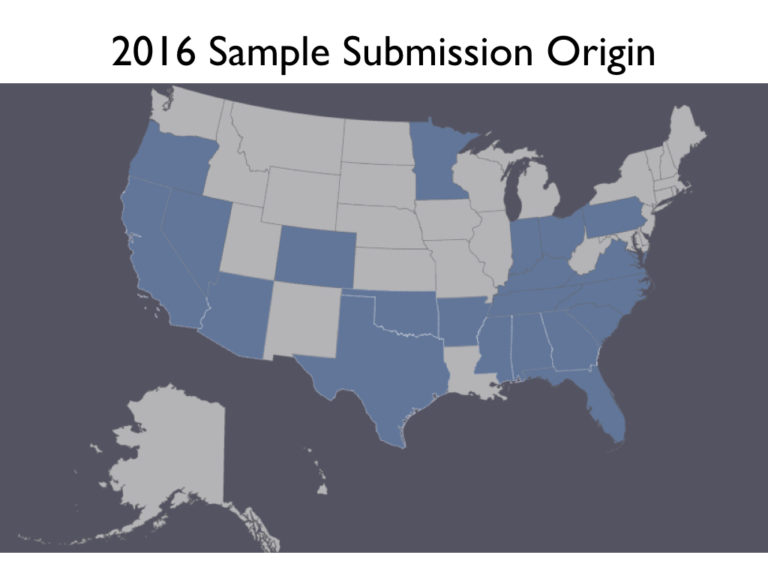
WARNING! – These charts only indicate the samples we have received in our lab here at NC State. While we do receive samples from various regions of the country, the majority (~80%) of creeping bentgrass and bermudagrass putting green samples come from the southeastern United States. The following post only covers data collected from all golf course samples. A similar landscape version will be posted soon.
We typically only receive samples from cases that are very hard to diagnose in the field alone. Simply put, we get the funky stuff! Therefore these charts don’t necessarily represent the major disease outbreaks, but illustrate what causes the most head scratching if you will.
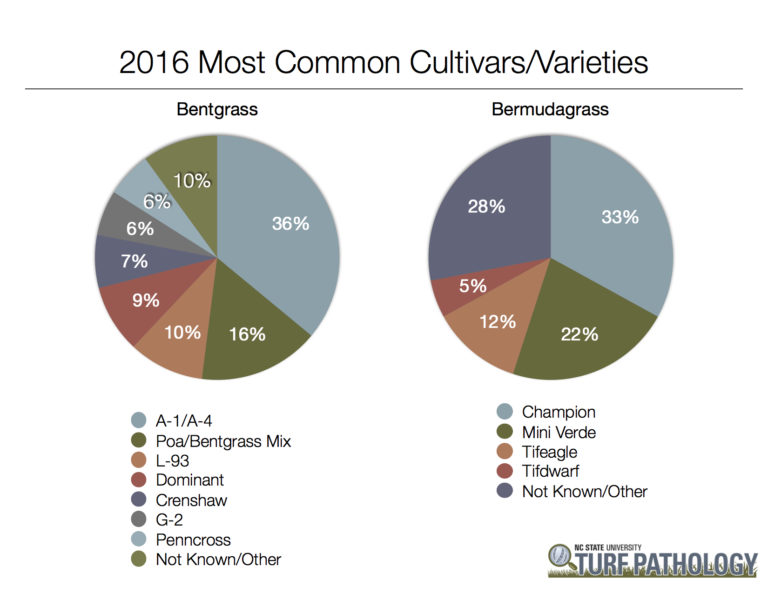
First, let’s take a look at which cultivars and varieties we receive the most. This is NOT an indication of one being more susceptible to disease or problematic than another. This was compiled from all samples submitted in 2016 and would likely match any survey that asks “What do you have planted?” Remember, we receive most of our samples from the southeastern US with the majority of those coming from right here in North Carolina
Next, let’s take a look at actual disease diagnoses. If you remember from an earlier post, the majority of the time we do not find any active disease causing organisms in samples. This could be due to any number of factors such as it never was a disease, it was a disease and the damage was done too long ago to detect, or it was a disease and you’ve suppressed it with your fungicide program. I’m looking right at you folks who send samples after spraying everything in the barn BEFORE you take your samples!
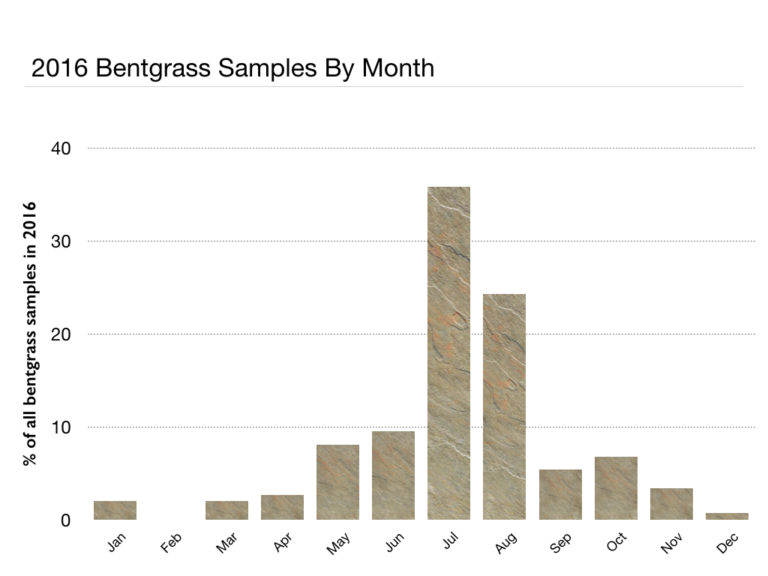
For the most part, creeping bentgrass samples followed the same trends we observed in 2015. The yearly chart above is usually about the same with the majority of samples coming during periods of stress between June and August as it always has been since we started tracking this information back in 2008.
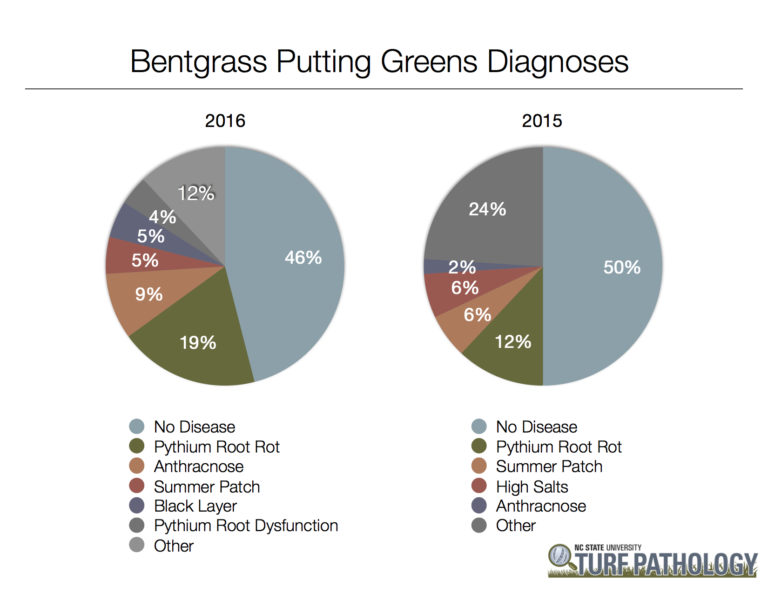
Now, think about all of the problems listed on the pie chart above. With the exception of summer patch when it creates nice little rings, they can all look similar! It’s very hard to diagnose any of these biotic and abiotic diseases in the field with 100% accuracy without looking under a microscope or testing for high salt levels. Once again, remember that rarely do growers send us samples of things like fairy ring, brown patch, dollar spot, etc. that are relatively easy to diagnose in the field. Also, receiving a diagnosis of “no disease” is equally as valuable as receiving a disease diagnosis. There are lots of things that cause turfgrass quality to decline, don’t assume it has to be a disease.
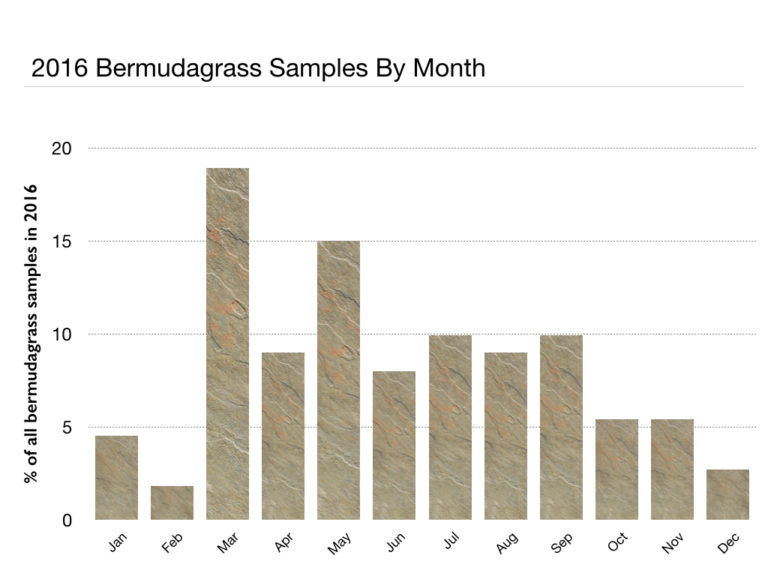
Just like the bentgrass chart, the bermudagrass chart follows a very similar path each and every year. The problems are fairly well distributed throughout the year with a spike in the spring at green-up.
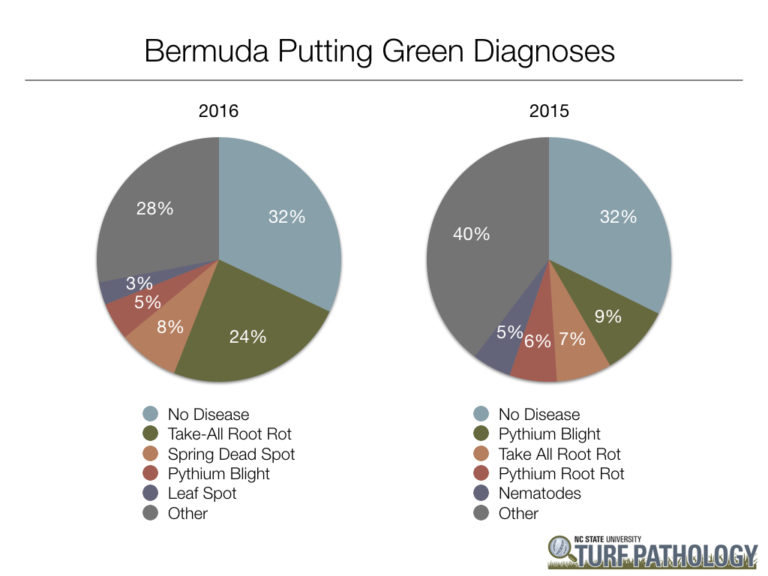
We did notice some differences in 2016 vs. 2015 with regards to bermudagrass samples. Take-all root rot (a.k.a. bermudagrass decline) moved to the top of the list. We saw a significant increase in the occurrence of this disease starting in fall of 2015 when weather conditions were abnormally wet and warm for extended periods of time. This damage continued into 2016, thus prompting many folks to submit samples for confirmation. Spring dead spot makes the top list for the first time, again likely due to a warmer/wetter fall in 2015. Mini ring doesn’t make the list again this year, however most people have learned how to diagnose that one on their own or we will confirm their suspicions via photographs, so very few physical samples are sent for confirmation.
Bottom line: As you can clearly see, both bentgrass and bermudagrass have their fair share of disease issues!
_____________________________________
NC STATE TURFGRASS REGIONAL CONFERENCE SERIES
3.0 NCDA & CS PESTICIDE CREDITS (L N D X)
3L NC LANDSCAPE CONTRACTORS’ LICENSING BOARD CREDITS
available each conference
NC State Regional Turfgrass Conferences benefit anyone managing a lawn/landscape. Pre-registration recommended to guarantee a spot.
Register now for these 2017 Regional Turfgrass Conferences:
REGISTRATION NOW OPEN FOR:
Western NC: April 4
____________________________________________
DON’T MISS OUT!
A few spaces left for 2017 NC State Turfgrass Short Course
Feb. 20-24
2017 NC State Turfgrass Short Course is a comprehensive turfgrass education compacted into one intensive week of study. This five-day course is appropriate for all interested in turf including homeowners, career-changers, and professionals needing a refresher. Lectures are presented by faculty of NCSU’s award-winning turfgrass program and cover all aspects of turfgrass management.
The NCSU Turfgrass Short Course is the best PRACTICAL how-to education you can get in a one-week study program. This program is held ONLY ONCE a year. Don’t miss out!
Information and registration: www.turfFiles.ncsu.edu/shortcourse