
N.C. Coastal Rivers Flood Mitigation
Major storms have exposed glaring vulnerabilities to riverine flooding in many N.C. Coastal Plain communities.
The content below was prepared by J. Jack Kurki-Fox and edited by Barbara Doll, Julie Leibach, and Jonathan Page.
In effort to characterize flooding problems in the coastal plain and to identify mitigation strategies, North Carolina Sea Grant and NC State University’s Biological & Agricultural Engineering Department have collaborated with the N.C. Department of Transportation (NCDOT), N.C. Emergency Management (NCEM), NC State University’s College of Design, the University of North Carolina at Chapel Hill, the Environmental Defense Fund and local governments.
- Read the team’s full report, “Flood Abatement Assessment for Neuse River Basin.”
- Read the executive summary.
This website summarizes the team’s findings and provides an overview of the resources available for coastal plain communities to increase their resilience to riverine flooding.
Major Floods
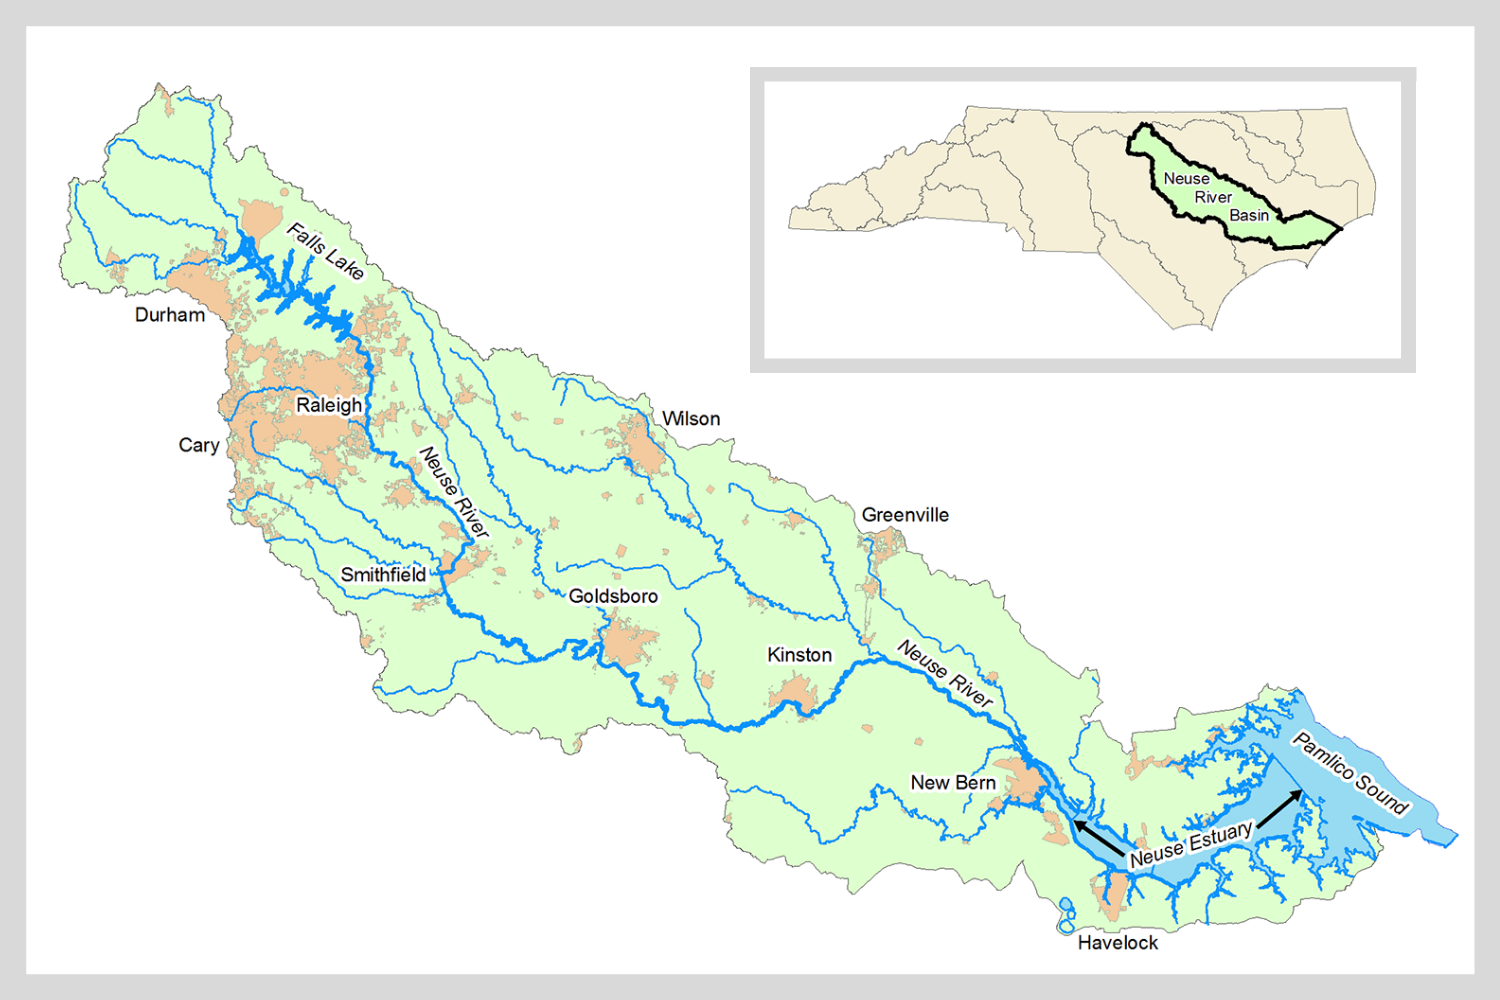
Since 1999, three hurricanes — Floyd, Matthew and Florence — caused billions of dollars in damage in eastern North Carolina, primarily due to major flooding in the coastal plain river basins of the Neuse, Cape Fear, Lumber, Cashie and Tar-Pamlico rivers (Table 1).
These hurricanes set many records for rainfall, river stage and discharge across the coastal plain, and the floodwaters remained for weeks in the hardest-hit areas. For example, riverine flooding after Hurricane Matthew persisted for two weeks in some areas (NCEM, 2017).
Storms like these appear to be part of a larger trend over the last four decades. Since the 1980s, the frequency, duration and intensity of North Atlantic hurricanes have all increased, particularly the frequency of Category 4 and 5 storms (Walsh et al., 2014).
| Storm | Year | Rainfall (inches)* | Damage (billions) | FEMA Disaster Counties | Fatalities |
|---|---|---|---|---|---|
| Florence | 2018 | 25-35 | $17.0 | 28 | 40 |
| Matthew | 2016 | 18-20 | $4.8 | 45 | 28 |
| Floyd | 1999 | 17-20 | $9.4 | 66 | 51 |
Transportation Impacts
The flooding impacts on transportation infrastructure and networks pose major problems for public services and emergency response.
Flooding closed more than 1,760 roads during Hurricane Matthew and more than 2,500 roads during Florence, according to the N.C. Department of Transportation Statewide Operations Center.
Short-term road closures occurred because of standing water and overtopping from streams. Meanwhile, road washouts that required repairs or complete reconstruction led to long-term closures. These impacts were not limited to local roads. Indeed, interstates including Interstate 40 and Interstate 95 were closed for more than a week after Hurricane Matthew, and again after Hurricane Florence.
Major interstate closures severely impair emergency service response and restrict the movement of essential supplies and services to critical areas. These closures also negatively affect the state and regional economy by slowing the movement of tens of millions of dollars in goods and services around the state and along the East Coast.
After Hurricane Florence, Wilmington was effectively cut off as all major roads, including I-40, leading to the city were submerged. In response, airlifts and resupplies by sea were considered.
Future Risks
In the last four decades, hurricane intensity, duration and frequency have all increased (Walsh et al., 2014). This trend is expected to continue as the Atlantic Ocean warms and the atmosphere stores more moisture (US EPA, 2016)
In addition to increasing overall hurricane strength, warming trends make rapid intensification, as observed with Hurricane Michael in the Gulf of Mexico, more likely (Ting et al., 2019), potentially reducing the timeframe for preparation and evacuation.
Recent research also indicates that hurricanes are moving slower, as observed with Harvey, Florence and Dorian (Kossin, 2018). More sluggish tropical storms increase the likelihood of extreme amounts of rainfall (that is, greater than a 1,000-year event, such as the rainfall that Florence produced, which exceeded 35 inches in Elizabethtown), and therefore the risk that more catastrophic riverine flooding will occur in the future.
In addition to stronger hurricanes, the amount of precipitation that falls during heavy storms (largest 1% of events) has increased 27% over the last 60 years in the Southeast.
This trend towards more intense rainfall events is expected to continue in a warming climate (Walsh et al., 2014).
Not only is the risk of major riverine flooding increasing, but the potential for more frequent flash floods on smaller streams is growing as well. Higher intensity storms are projected to increase inland flooding as a result of heavy runoff by up to 40% by 2050 in North Carolina (Walsh et al., 2014).
Improving Resilience
Resilient Routes
- Takeaway: Upgrading all roads inundated during extreme events is not feasible. A system of designated routes designed to resist damage and stay open during extreme flooding can provide more reliable access to critical areas.
In response to prolonged closures of U.S. Highway 70, I-40 and I-95, the concept of “resilient routes” has emerged. A resilient route is a transportation corridor designed to resist damage and remain open during extreme flooding in order to provide access to critical areas.
Upgrading all roads inundated during extreme events is not financially or technically feasible. Strategically identifying and upgrading transportation routes that experience minimal flooding and that will enable evacuation, emergency response, post-event access and transfer of goods and services represents a more cost-effective, logical and systematic approach.
Existing problem areas along these routes would be designed to be resilient to extreme events (e.g., 500-year or 1,000-year event). Meanwhile, other roads or river crossings would be allowed to flood and potentially close during extreme events.
In urban areas where there are numerous stream crossings that flood, the less used, redundant crossings could be eliminated to reduce future maintenance and risk of ecological impacts, structural failure or loss of life. In some instances, this approach could reduce upstream flooding caused by flow obstruction from severely undersized stream crossings.
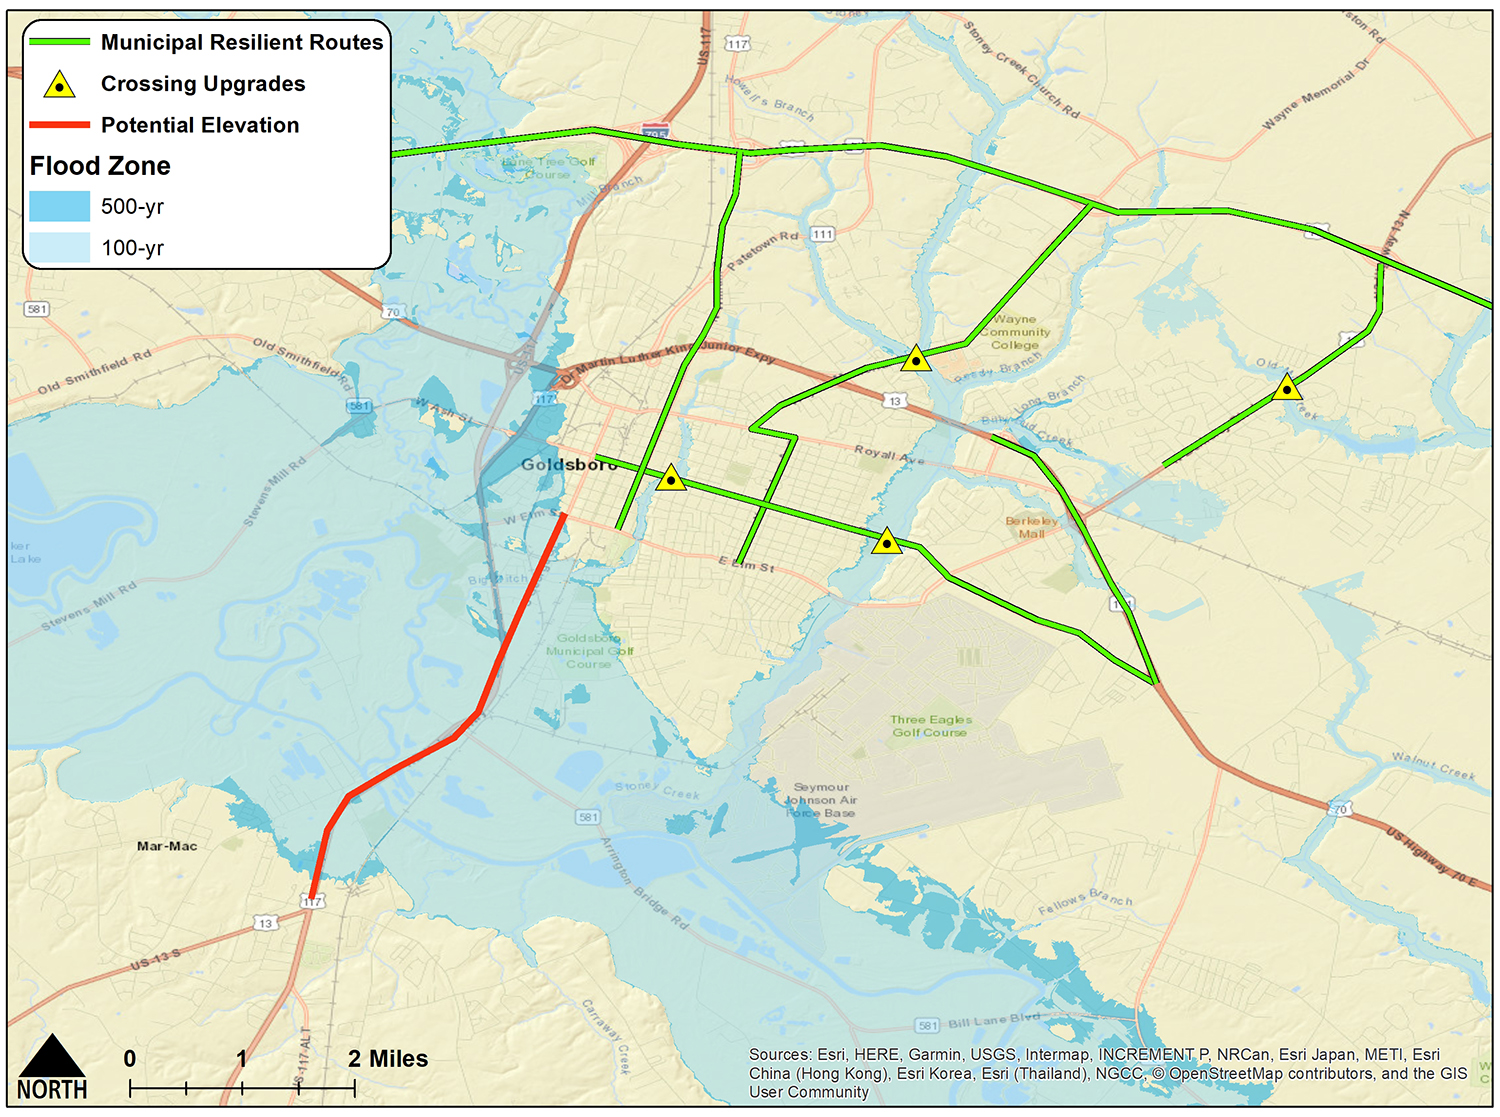
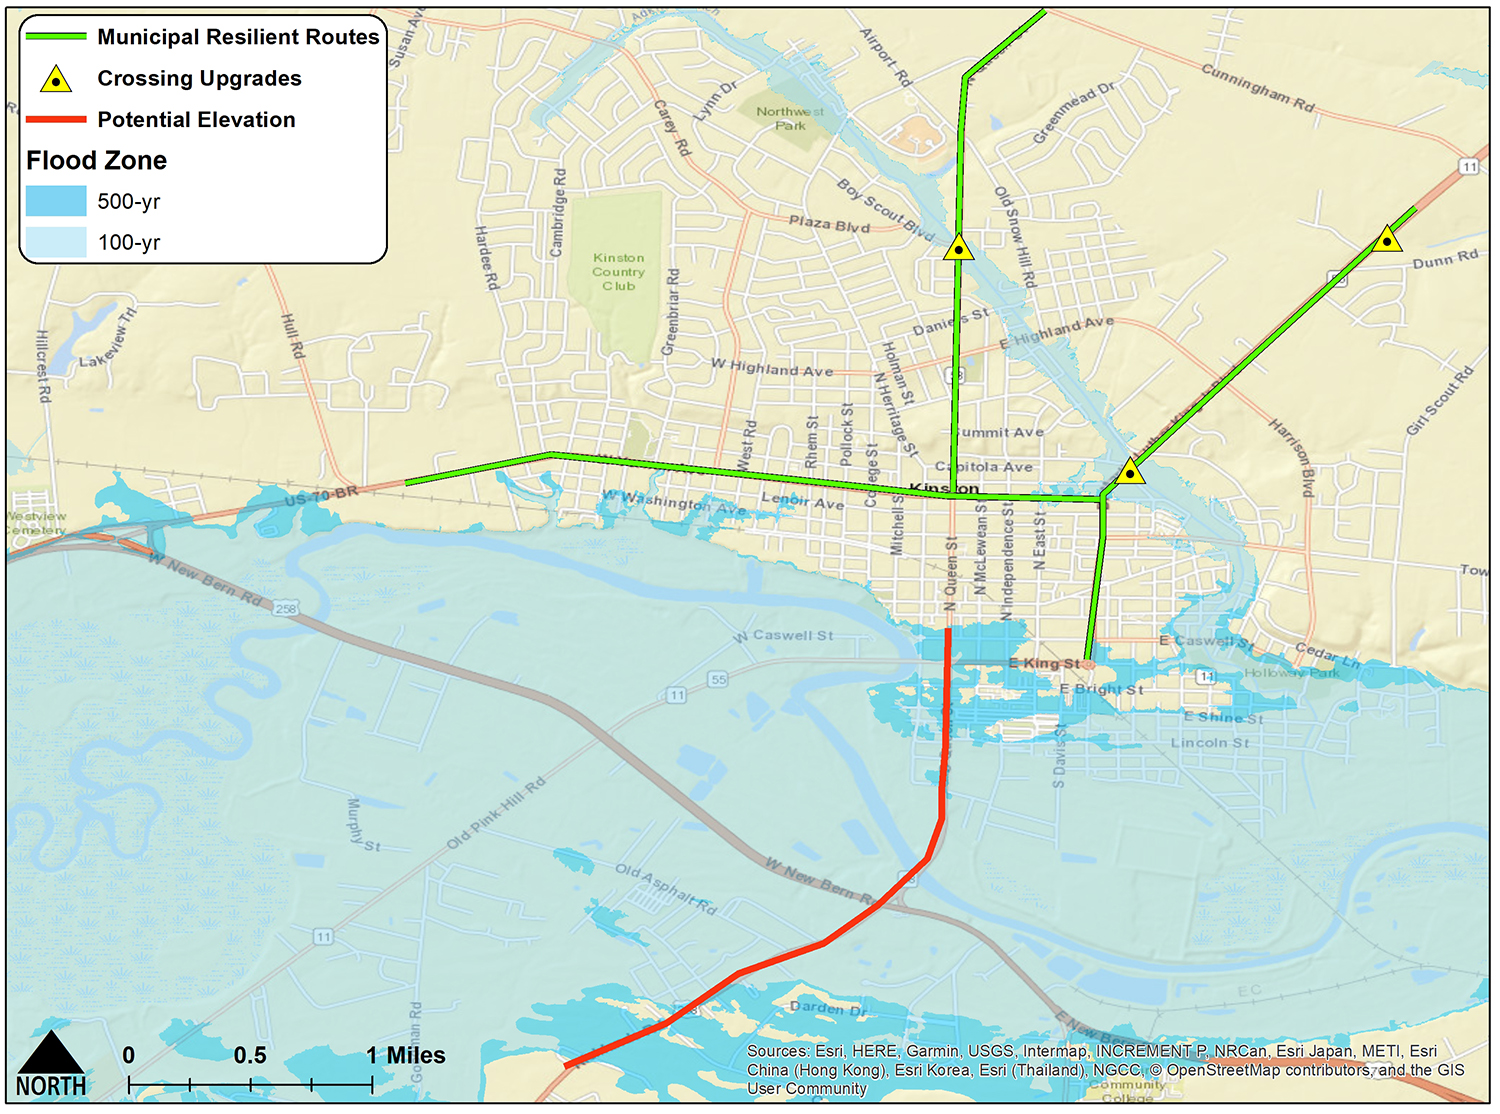
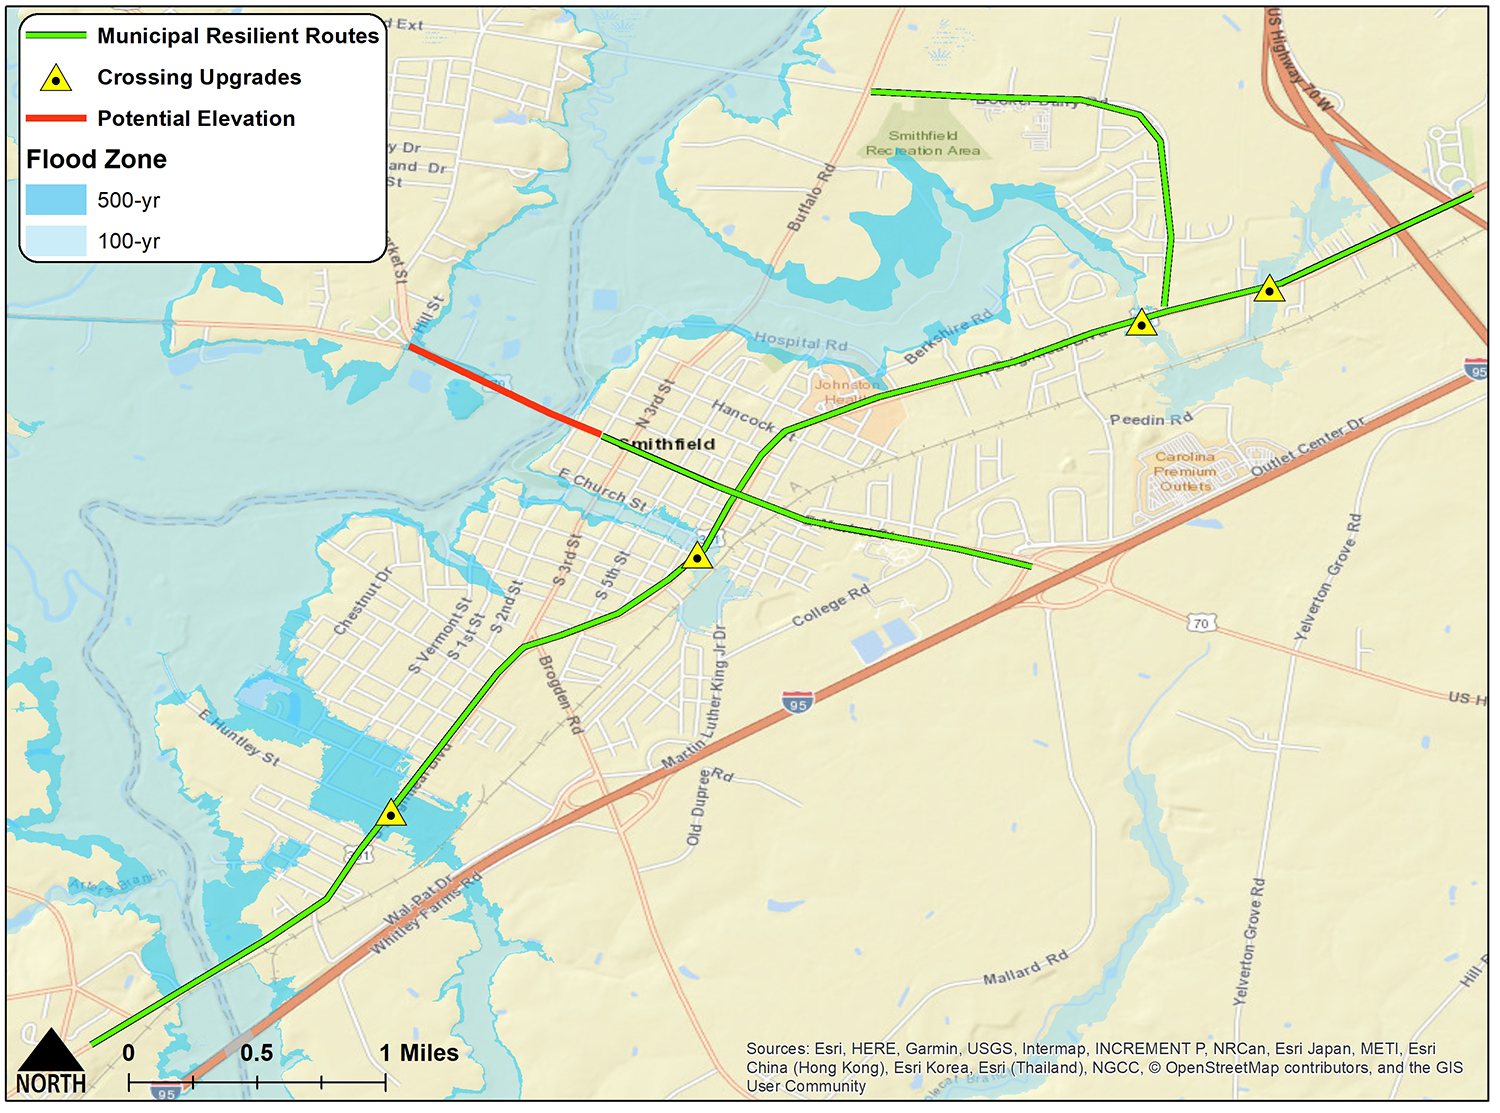
Below are examples of resilient routes in Smithfield, Goldsboro and Kinston.
Resilient routes in Smithfield, Goldsboro and Kinston.
Improving Design Standards
- Takeaway: Road design standards can be updated to accommodate increasing rainfall frequencies, intensities and accumulations associated with climate change
Design standards for roadways and river crossings are based on risk calculated from historical rainfall and streamflow observations.
For example, many NCDOT stream crossings on secondary roads are designed for a storm with a 25-year return period. That return period does not mean that a given crossing will be overtopped only once in 25 years. Rather, a 25-year return period refers to an event that has a 4% probability of occurring in any given year, based on historical observations for that location.
Over a longer period, the chance of the storm occurring increases. Over a 30-year timeframe, for instance, there is a 71% chance of a 25-year event occurring and overtopping the road (see Table 1).
Table 1. Return period and probability of occurrence.
| Return Period (years) | Annual Probability of Occurrence (%) | Probability of occurrence in 30-year time span (%) |
|---|---|---|
| 10 | 10 | 91 |
| 25 | 4 | 76 |
| 50 | 2 | 46 |
| 100 | 1 | 26 |
| 500 | 0.2 | 6 |
However, as storm severity increases (Walsh et al., 2014), the amount of rainfall for a given return period may have a higher probability of occurrence today than in the past.
For example, historical data for Goldsboro indicate that 7.2 inches of rainfall in 24 hours has a 4% chance of occurring in a given year — in other words, that amount of rainfall has a 25-year return period. But with the trend towards more intense rainfall, this event may have an annual probability of occurrence that is substantially higher than 4%.
Florence, Matthew and Floyd rainfall accumulations were in the range of 100-to-1,000-year return periods, depending on the location. Roadway and stream crossing design standards may need to be modified to adjust to a new level of risk as the climate changes. Some potential modifications to design standards include:
- Increase the return period for future projects.
- Use climate model output to design for future storm events.
- Transition away from using a return period approach. For example, in the Netherlands, design standards are based on preventing any loss of life or loss of use for the most critical routes.
River Crossings
- Takeaway: Modifying bridges in the lower Neuse River floodplain has limited effect on reducing upstream flooding from extreme events.
The perception that many bridges exacerbate upstream flooding is common among eastern North Carolina communities. As part of two research projects, extension staff used hydraulic models to evaluate the impacts of bridges on upstream water level.
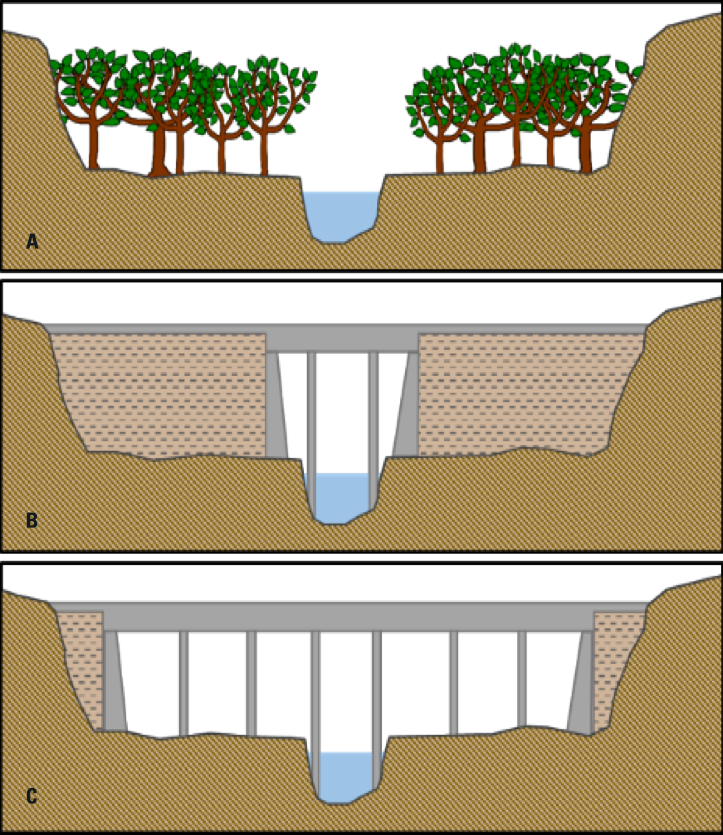
Bridges over the Neuse River in Smithfield, Goldsboro, Kinston and Craven County and over the Cashie River in Windsor were evaluated. The impact of the bridges on upstream water surface elevation was evaluated by modifying the river crossings (i.e., increasing the capacity by removing the floodplain embankments and increasing the bridge deck span (see Figure 1) or raising the bridge deck elevation) and comparing the model results to the existing condition.
The model results indicated that substantially increasing the capacity of the crossings (by a factor of 10 or more in most cases) would have minimal impact on the water surface elevation upstream. For most of the river crossing the change in water surface upstream was less than 1 foot, and often less than a half foot for the Matthew-scale event. This minimal reduction in water surface was attributed to several factors:
- The primary reason was often the presence of a backwater effect from the river downstream of the bridge that occurs during flood events. Even if bridges were removed completely, the downstream backwater effect would limit any reduction in water surface elevation. Backwater conditions are the result of the very low valley slope of the Coastal Plain landscape combined with the substantial flow volumes. River slope in the middle and lower Coastal Plain is generally only about 1 to 2 feet per mile, and slope is the main driver of flow. In addition to the very low slope, the discharges recorded at gauges maintained by the United States Geological Survey on the Neuse River ranged from 30,000 to 50,000 cubic feet per second during recent major flood events. This volume of flow is equivalent to an Olympic-size pool every 2 to 3 seconds.
- In some cases, there are several bridges in close proximity to one another, and modifying one bridge has minimal impact on water surface because the others also obstruct flow. For example, there is a railroad bridge directly downstream from U.S. 301 in Smithfield. Both the U.S. 301 and railroad bridges would need to be modified to achieve any benefits. In some cases, the river overtopped the crossings during extreme events. In these locations, modifying the crossing had little impact on the upstream water surface because water was already flowing over the bridge. If the bridge were raised, this may actually exacerbate upstream flooding. While the overtopped bridge is an issue because of the lack of access and safety risk, the conveyance over the bridge may limit flooding in areas upstream.
Natural Infrastructure
- Takeaway: Landscape features such as forests and wetlands can be strategically used to provide water storage and potentially mitigate flooding.
Natural infrastructure is landscape features — forests, wetlands, floodplains, riparian buffers — that provide benefits to the environment and society. In North Carolina, government, academic and nonprofit groups are discussing how natural infrastructure can be expanded to provide water storage and potentially mitigate flooding.
A recent modeling study conducted by NC State University indicated that strategic implementation of natural infrastructure on the landscape can provide benefits. Researchers modeled two scenarios evaluating natural infrastructure in two watersheds:
(1) reducing runoff though increased infiltration and storage on the landscape and
(2) stream restoration to increase floodplain conveyance area
For the first scenario, the team considered two methods:
- Reforestation/conversion of agricultural land or other open space to timber plantations and forest. This method would require purchase, easements or incentives to convert low-productivity croplands or other row crops to timber.
- Storage of floodwater on upland agricultural areas and forests. This method would require development of a program to lease land from farmers for the purpose of temporarily flooding the property during extreme events. Growers would be compensated for allowing the water storage and for crop losses. Production would continue as normal during periods in which major storm events did not occur.
Results indicated that peak discharge could be reduced by 20 to 30% in a 30-square-mile watershed for the most intensive implementation scenario for the 100-year event. The change in water surface elevation ranged from 0.5 to 2 feet. These results verify the potential for natural infrastructure to reduce flooding.
In a smaller, more developed and extremely flood-prone watershed, reach-wide stream restoration with floodplain expansion was modeled along a straightened, armored stream (see Figure 2). The results indicated that neither road crossing improvements nor stream restoration alone will substantially reduce flooding. Rather, a combination of both approaches is necessary to achieve substantial flood reduction benefits. For this particular project, benefits could be realized for the 100-year and greater events.
North Carolina Sea Grant and NC State’s Biological and Agricultural Engineering Department also worked with several partners and led a multidisciplinary, inter-institutional effort to evaluate the flood reduction potential of natural Infrastructure. The team evaluated large-scale implementation of natural infrastructure measures to increase water storage capacity and reduce flooding in the middle Neuse River Basin.
Opportunity mapping, hydrology and water quality modeling for implementation of flood control wetlands, reforestation and water farming were first completed for three sub-watersheds: Little River, Bear Creek, and Nahunta Swamp. The team then extrapolated the results to the other sub-watersheds of the middle Neuse Basin.
Watch the video: Evaluating Nature Based Solutions for Mitigating Riverine Flooding in Eastern North Carolina
Floodplain Buyout
- Takeaway: Buyouts of flood-damaged and flood-prone properties is the only practice that guarantees that future losses are avoided.
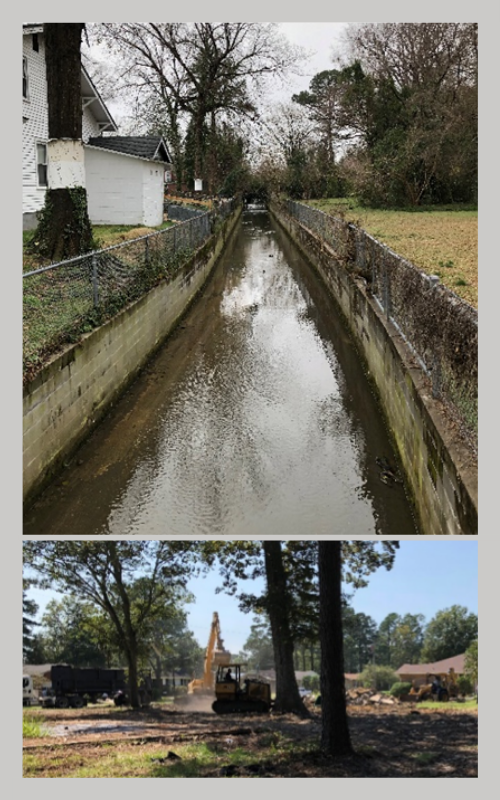
Figure 3, bottom: Workers demolish a house on property acquired though the FEMA HMGP in Lumberton.
Among the resilience measures discussed here, buyouts of flood-damaged and flood-prone properties is the only practice that guarantees that future losses are avoided.
Funding for property buyouts is allocated through FEMA’s Hazard Mitigation Grant Program (HMGP) and through some local governments that fund their own buyout programs. Following a major disaster, FEMA allocates HMGP funds to the states. The state and local government can then identify flood-damaged properties that are eligible for buyouts.
The property owners can elect to participate in the program, which provides funding based on pre-disaster market value. FEMA covers 75% of the cost of acquisition through the HMGP, while the state or local government covers the remaining 25%.
After properties are acquired through the grant program, the local government assumes ownership, and the structures are demolished (see Figure 3). Redevelopment is then restricted to open-space uses (FEMA, 2018). The buyout process is not always easy, requiring coordination between property owners, local and state governments, and FEMA, and can take years to complete (Weber and Moore, 2019).
In North Carolina, over 5,000 buyouts have been completed since the mid-1990s, most as a result of damage caused by hurricanes Fran and Floyd. As of December 2019, nearly 650 properties damaged by hurricanes Matthew and Florence had been acquired, with more expected (Table 2).
Table 2. HMGP Buyouts in North Carolina
| Hurricane | Buyouts |
|---|---|
| Fran | 1,146a |
| Floyd | >3,000b |
| Matthew (to December 2019) | 472c |
| Florence (to December 2019) | 172c |
In addition to preventing future losses, areas where buyouts occur can be repurposed to provide important ecosystem services such as water storage or wildlife habitat. Buyout areas can also be converted into community amenities such as parks, greenways and athletic fields.
FEMA HMGP grants can also be secured by local governments to help homeowners raise the elevation of flood-damaged structures or relocate structures to higher ground. Over 400 structures were elevated following Hurricane Fran (Glavovic and Smith, 2014). Through buyout and elevation efforts, North Carolina communities have avoided hundreds of millions of dollars in potential losses (ReBuild NC, 2017).
Improving Floodplain Ordinances
- Takeaway: Modifying the language of floodplain ordinances is a relatively simple, low-cost action municipalities can take to improve their resilience to storms and prevent future damage.
The most influence municipalities can exert over floodplain management is through their floodplain management ordinances.
Recent research by NC State and the University of North Carolina at Chapel Hill revealed that there is very little variation in ordinance language throughout the state, and even across the country. Ordinances are typically based on standard boilerplate language that satisfies the minimum requirements set by FEMA and the National Flood Insurance Program (NFIP). This approach has led to increased or uncontrolled development in some coastal plain communities. From 2001 to 2016, development in the 100-year floodplain increased by an average of 17% in Smithfield, Goldsboro and Kinston.
As storm frequency and intensity are projected to increase, modifying the language of floodplain ordinances is a relatively simple, low-cost action municipalities can take to improve their resilience to storms and prevent future damage.
Potential modifications include further restricting development in the 100-year floodplain, increasing the minimum required freeboard above base-flood elevation, and modifying the regulatory floodplain. These steps can reduce future property damage and potentially prevent loss of life.
Actions like these may be particularly important given the impacts of climate change. For example, a recent modeling study by NC State University’s Department of Biological & Agricultural Engineering indicates that the elevation of the 100-year flood could increase by 2 to 5 feet along the Neuse River in eastern North Carolina by 2100.
Given the likelihood of more severe storms, prohibiting developing within the 500-year floodplain and considering elevation restrictions that place all structures a safe distance above the anticipated 500-year flood level is advisable.
Below are two case studies that illustrate modifications that municipalities can implement to improve resilience to future floods.
1. Cedar Falls, Iowa
After recurrent destructive floods in the 1990s and then again in 2008, Cedar Falls modified their floodplain ordinances to limit future damages by ensuring that future development is resilient to major flooding.
Cedar Falls made several modifications that exceeded the minimum FEMA standards. Some of the major changes include:
- Prohibit the construction of any new building or structure in the floodway and severely restrict the reconstruction of damaged structures
- Set the 500-year flood boundaries as the regulatory floodplain, and require that any structures within those boundaries be elevated at least 1 foot above the 500-year flood elevation.
- Prohibit the planning of new lots in the 500-year floodplain.
- Require that all critical facilities (e.g. schools, fire stations, etc.) be located outside of the 500-year floodplain.
The Cedar Falls floodplain ordinance is one of the most protective in the nation. The ordinance, combined with an aggressive buyout strategy, is intended to prevent high-risk development, reduce future damages and increase long-term resilience.
2. Charlotte and Mecklenburg County, North Carolina
Charlotte-Mecklenburg Stormwater Services (SWS) has undertaken an extensive effort to enhance their floodplain maps to account for future conditions.
Charlotte-Mecklenburg SWS’s maps include a “community floodplain” and a “community floodway” that extend beyond the FEMA floodplain and floodway in many locations. The “community” zones take into account future land use changes in the watershed and supersede the FEMA maps for regulatory purposes.
Louisville, Kentucky, implemented a similar approach using flood maps that account for fully developed conditions.
The Charlotte-Mecklenburg and Louisville examples illustrate how forward-thinking municipalities can increase their resilience by planning for future conditions, thus minimizing risk.
Forecasting and Planning
There are several free tools available that municipalities can access to help them stay abreast of severe storm events and potential associated flooding before and during extreme events, and to help them better understand, communicate and plan for future risks.
Southeast River Forecasting Center
The Southeast River Forecasting Center (SERFC) provides five-day forecasts for river stage and discharge at 34 locations in North Carolina. The forecasts are based on the output from a complex regional model that considers rainfall and combines watershed runoff and river flow. View the forecasts.
National Weather Service Products
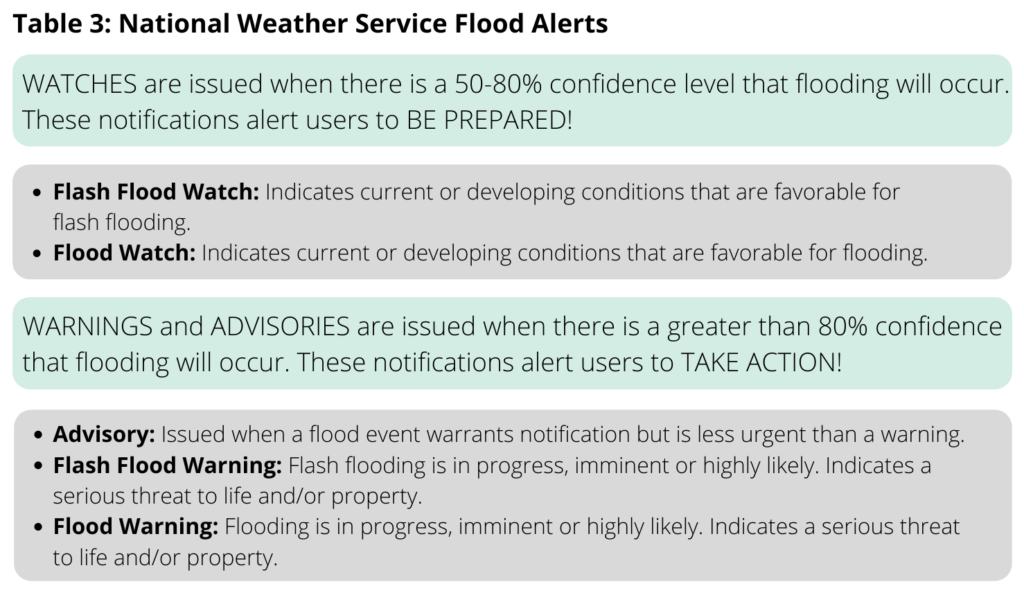
The National Weather Service (NWS) provides many important tools to the public. For example, it provides flood alerts across a range of platforms.
Flood alerts are based on two levels: watches and warnings. More information regarding the NWS flood hazard alerts can be found on this NWS page.
Flood Inundation Mapping and Alert Network (FIMAN)
The Flood Inundation Mapping and Alert Network (FIMAN) is a tool developed by NCEM to map flood extents and possible damages in real time at stream gauges. It provides flood inundation limits (that is, the areal footprint of the flooded area) and damage estimates at 232 gauges operated by the U.S. Geological Survey and NCEM.
Using modeling and elevation data, FIMAN relates the river stage measured at a stream gauge to the extent and depth of flooding for an area 1 to 2 miles upstream and downstream from the gauge. The extent and depth of flooding is then related to the locations of structures in order to estimate damages.
FIMAN incorporates streamflow forecasts, if available, from the National Oceanic and Atmospheric Administration’s Southeast River Forecasting Center to provide an early warning of flooding impacts. Users can sign up to receive email and text alerts for specific locations when the river reaches certain flood levels.
The mapping tool also provides current weather radar and a flood risk rating (e.g., normal, minor flooding, moderate flooding, etc.) and trends in river water elevation (i.e., constant, rising, falling) for all gauge locations. Learn about the FIMAN tool.
Floodplain Maps and Risk Assessment Tools
The North Carolina Floodplain Mapping Program is one of the most advanced floodplain mapping programs in the country. Its N.C. Flood Risk Information System (FRIS) website provides access to FEMA floodplain maps across the state for the floodway — 100- and 500-year boundaries — where available.
The site also provides tools to assess risk and estimate the cost of damages, as well as possible mitigation measures. A tool is available to estimate the cost of flood insurance for a given location, too.
Most floodplain maps from the FRIS website can be exported in the form of PDF maps of GIS compatible formats.
References
American Rivers. (2017). American Rivers Dam Removal Database. figshare.
Casey, M., Lieb, D. A. (2019). North Carolina No. 2 In Risky Dams Where Failure Could Kill. Retrieved December 6, 2019.
Doll, B. A., Line, D. E., Page, J., Youssef, M., Negm, L., Tian, S. (2018). Cashie River and Town of Windsor Flood Mitigation Study. Raleigh, NC.
FEMA. (2009). Remembering Floyd: 10 Years Later. Retrieved November 27, 2019.
FEMA. (2018). FACT SHEET: Acquisition of Property After a Flood Event. Retrieved November 27, 2019.
Glavovic, B. C., Smith, G. (2014). Adapting to climate change: lessons from natural hazards planning. Springer Science & Business.
Gutmann, E. D., Rasmussen, R. M., Liu, C., Ikeda, K., Bruyere, C. L., Done, J. M., … Veldore, V. (2018). Changes in Hurricanes from a 13-Yr Convection-Permitting Pseudo–Global Warming Simulation. Journal of Climate, 31(9), 3643–3657.
Ho, M., Lall, U., Allaire, M., Devineni, N., Kwon, H. H., Pal, I., … Wegner, D. (2017). The future role of dams in the United States of America. Water Resources Research, 53(2), 982–998.
Kossin, J. P. (2018). A global slowdown of tropical-cyclone translation speed. Nature, 558, 104–107.
NCEM. (2017). Hurricane Matthew Resilient Redevelopment Plan Southeast Region. Raleigh, NC.
NCEM. (2018). Neuse River Basin Flood Analysis and Mitigation Strategies Study. Raleigh, NC.
NCEM. (2019a). Hurricane Florence Expedited Acquisitions. Raleigh, NC: North Carolina Emergency Management.
NCEM. (2019b). Hurricane Matthew Hazard Mitigation Grant Program Awards. Retrieved November 25, 2019.
Office of the Governor. (2017). NC Gov. Cooper: One Year Later: North Carolina Continues Recovering from Hurricane Matthew. Retrieved December 10, 2019.
Office of the Governor. (2018). Hurricane Florence Recovery Recommendations Building Communities Stronger and Smarter Based on Preliminary Damage and Needs Assessment. Raleigh, NC: PDF.
ReBuild NC. (2017). ReBuild NC: Hazard Mitigation Grant Program. Retrieved December 6, 2019.
Schembri, F. (2018, September 21). Testing and cleaning North Carolina’s water supply post-Florence could prove tricky. A microbiologist explains why. Science Magazine.
Schmutz, S., Moog, O. (2018). Dams: Ecological Impacts and Management. In Riverine Ecosystem Management (pp. 111–127). Springer International Publishing.
Sound Rivers. (2018). Hurricane Florence Exposes Problems with Wastewater Infrastructure – Sound Rivers. Retrieved December 4, 2019.
Ting, M., Kossin, J. P., Camargo, S. J., Li, C. (2019). Past and Future Hurricane Intensity Change along the U.S. East Coast. Scientific Reports, 9(1).
US EPA. (2016). What Climate Change Means for North Carolina. Washington, D.C.: U.S. Environmental Protection Agency.
Walsh, J., Wuebbles, D., Hayhoe, K., Kossin, J., Kunkel, K., Stephens, G., … Meteorological Office Richard Somerville, U. (2014). Our Changing Climate. Climate Change Impacts in the United States: The Third National Climate Assessment. Washington, DC: PDF revised.
Weber, A., Moore, R. (2019). Going under: Long wait times for post-flood buyouts leave homeowners underwater. New York: PDF.